


SIMPLACE Crop Manager
For the non-experienced user, the graphical user interface (GUI)-level is most important. It works with a highly transparent pipeline approach where users have easy access to and can enter relevant information.
For more detailed documentation see simplace.net/doc – here you can find how to install and run SIMPLACE in the "Getting started" section. A scientific documentation is provided in: SIMPLACE – A versatile modelling and simulation framework for sustainable crops and agroecosystems
Example application of a model solution
The SIMPLACE Application starts with the option to choose one of the implemented systems, namely one of the prepared model solutions.
After starting the system, the user is provided with the option to display and/or modify the model in the embedded solution editor.
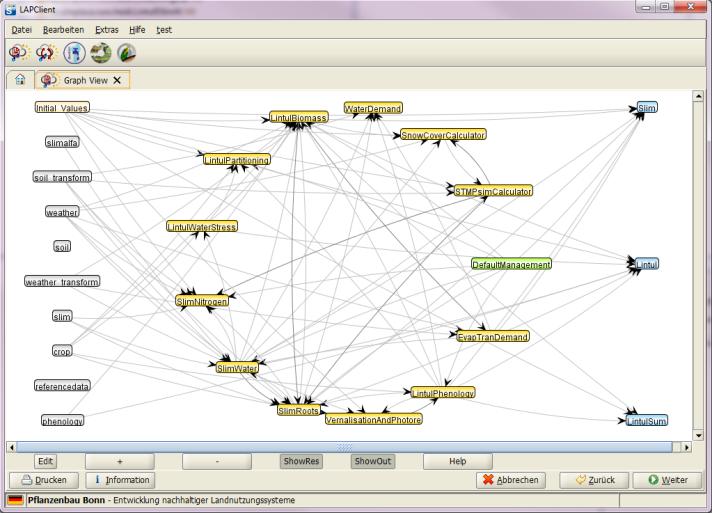
After configuring the solution to their situation in terms of for example constants the background process is initiated. A defined set of outputs is generated for the user.
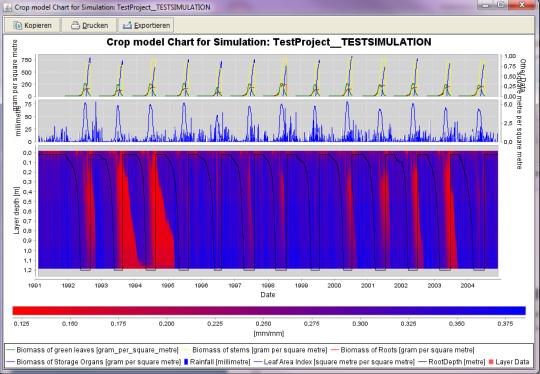
Solutions can also be run in the browser with the web client, which shows the outputs as diagrams – see Interfaces.